Overview
Rosehill provides another opportunity to test the relationship between early position, barriers and the state of the track. A headline win rate can be interesting, but TrackBro encourages users to check the sample size and whether the betting market already accounted for the pattern.
What to investigate next
Do inside barriers remain advantageous when the going changes? Does the advantage persist with different rail positions? Does an on-speed horse drawn wide perform differently from an inside-drawn leader? Explore these questions using TrackBro rather than treating one historical percentage as a rule.
Racecourse map
View the Rosehill map in the Australian Turf Club's 2022 tracks PDF. The PDF includes multiple tracks; find the Rosehill map in the document. This dated reference is hosted by the publisher and may not reflect the current layout.
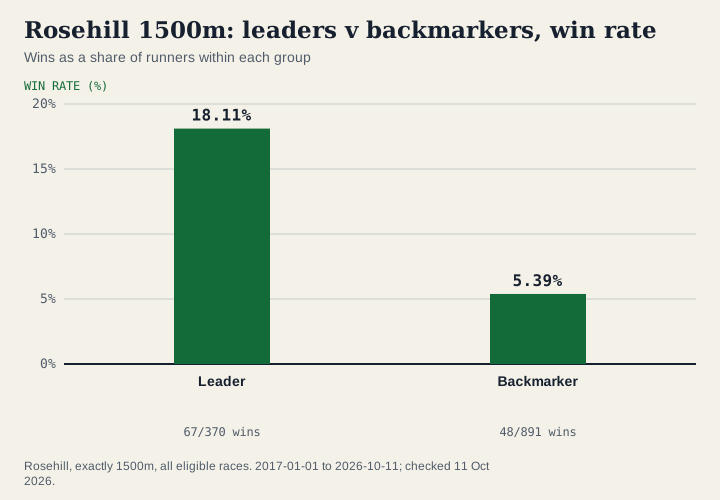
Historical Rosehill 1500m: leader versus backmarker
Source: TrackBro active production historical research records; checked 11 October 2026. Owner-approved verification window: 1 January 2017–11 October 2026 inclusive (newly adopted, not the original export period). Rosehill exactly 1500m; 371 qualifying races and 4102 runner records, spanning 2017-01-28 to 2026-09-26. All eligible races at this track and distance, not only feature-race editions. Settling-position cohorts exclude missing values; all 370 leaders are A2E eligible. Historical observations are descriptive, not forecasts.
| Settling-position band | Wins | Runner records | Win rate |
|---|---|---|---|
| Leader | 67 | 370 | 18.11% |
| Backmarker | 48 | 891 | 5.39% |
Leaders recorded +46.4% historical SP ROI and 1.52 A2E, covering all 370 leader runner records.
Win rate is wins divided by runner records within each group, not the share of all winners. These percentages do not need to add to 100%. Each first-place runner counts as one full win, including shared wins.
Settling position is recorded after the race, not known in advance. Categories use field-relative bands: leader = position 1; otherwise on speed up to 30%, midfield up to 60%, worse than midfield up to 80%, and backmarker beyond 80% of (position − 1)/(stored field size − 1). Missing settling positions are excluded from these categories.
Historical SP ROI assumes one unit on every runner in the group, with winning returns at recorded decimal starting prices and divided for dead heats. A2E normalizes reciprocal starting prices across complete confirmed fields before filtering; actual and expected wins use the same eligible runners. Positive historical returns are not a future-return forecast.